

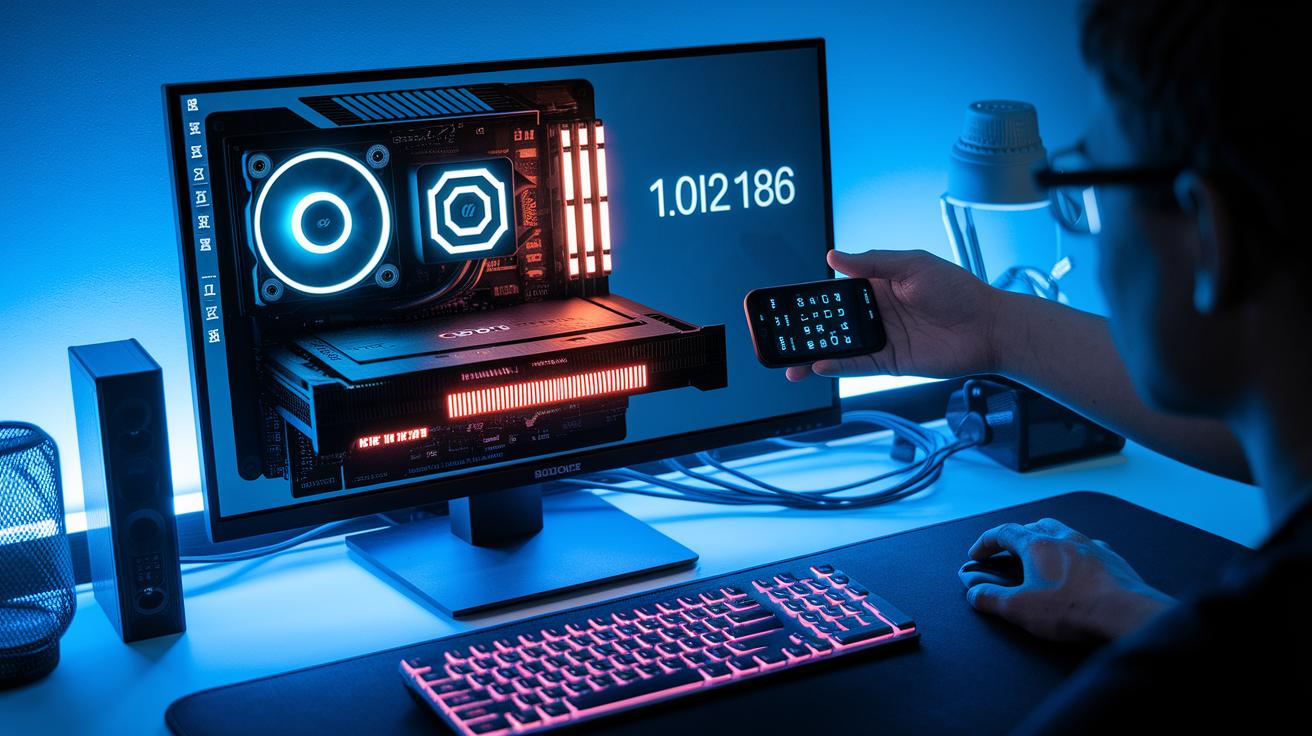
Have you ever wondered why a simple render can slow your project down so much? Chances are your GPU (graphics processing unit) isn't running at its peak. Think of it like a race car that needs a tune-up to perform its best. Overheating, outdated drivers, or a VRAM (video memory) overload can interrupt your workflow and cost you valuable time. In this post, we share clear and fast fixes to help you boost your render speed and keep your projects flowing smoothly. Let's get started and get your GPU back in shape.
Rapid Troubleshooting Steps for GPU Rendering Failures
Begin by checking your GPU (graphics processing unit) temperature. If your GPU overheats, it may drop frames and trigger Windows TDR (timeout detection and recovery) events when it stops responding for more than two seconds. For example, one user experienced a crash when the GPU temperature hit 90°C during an intense scene.
Next, confirm that your GPU drivers are up to date. Outdated or incompatible drivers can cause conflicts that lead to illegal memory access errors, such as error code TDR 0x000001. Take a look at your diagnostic logs for any driver warnings and compare the driver version with the manufacturer’s recommendation.
Then, check for signs of VRAM (video memory) overload. High-resolution assets like 8K textures, dense meshes, or complex volumetric effects can push memory allocation past its limit. Use your GPU monitoring tools to spot VRAM usage spikes and error messages related to memory issues.
Also, try resetting the kernel cache. Clearing and rebuilding these caches can often resolve illegal memory access errors and restore system stability.
Lastly, refine your assets. Lowering texture resolutions and reducing polygon counts can ease VRAM pressure and boost render performance. Review your logs to identify recurring error patterns, and then adjust your render settings based on the feedback.
Diagnosing VRAM Overload and Memory Exhaustion in GPU Renders

Start by keeping an eye on key GPU details such as temperature, VRAM usage (video memory), and driver stability with tools like GPU-Z. GPU-Z can highlight sudden increases in VRAM, which might suggest overheating or may lead to driver resets. Also, review your log files to find any out-of-memory errors, driver resets, or memory leaks caused by issues like faulty buffer resets or plugin mismatches.
To lower the load on your GPU, optimize your assets by following these steps:
- Use tools like GPU-Z to monitor temperature and VRAM usage in real time.
- Check system logs for repeated memory error patterns.
- Simplify your assets by reducing texture resolution and lowering polygon counts. For example, switching an 8K texture to a 4K version can noticeably cut VRAM usage.
- Regularly clear caches to help prevent memory leaks.
| Diagnostic Step | Tool/Action | Note |
|---|---|---|
| GPU Temperature & VRAM Monitoring | GPU-Z | Helps detect spikes and overheating |
| Log File Review | System logs | Highlights errors and driver resets |
| Asset Optimization | Reduce resolution/polygon counts | Minimizes memory load |
gpu rendering troubleshooting: Ignite fast fixes

Old or mismatched GPU drivers may cause render instability, especially when your engine needs the latest CUDA (NVIDIA compute toolkit) or OptiX libraries. Start by checking your driver version against the manufacturer's guidelines. For example, verify that your NVIDIA driver matches your render engine's requirements. Running a diagnostic command can help you spot error codes such as TDR timeouts that may indicate driver resets.
Next, perform a clean installation of your drivers. Remove any old drivers completely before adding the new version. This step helps prevent conflicts that can cause illegal memory access errors. If your driver still feels unstable, consider reinstalling or switching to an earlier version. We suggest following safe rollout workflows, like those in our guide gpu driver update best practices for stability, to ensure a smooth update.
If issues remain even after a clean install, try rolling back to a previous driver version that you know works reliably with your rendering software. Also, check that all API versions and toolkits like CUDA are in sync with your driver to avoid compatibility issues.
To simplify troubleshooting, use this checklist:
| Step | Action |
|---|---|
| 1 | Check your current GPU driver version |
| 2 | Clean-install updated drivers |
| 3 | Rollback if necessary |
| 4 | Confirm version parity between your render engine, CUDA toolkit, and GPU driver |
Following these steps can help you quickly resolve driver conflicts and keep your GPU stable during heavy rendering tasks.
Managing GPU Overheating, Thermal Throttling & Power Supply Issues

Begin by keeping a close eye on your GPU temperature with sensor tools. When temperatures climb above 85 °C, your GPU might slow down to protect itself, which can cause frame drops or render hangs during complex scenes. Check your fan curves using the vendor-supplied tools and make sure the heatsinks are free of dust. Dust can block airflow and force your GPU to run hotter than it should.
Review your cooling setup next. Ensure that all fans are spinning correctly and that there is enough room around your system for proper air circulation. Manually adjusting fan speeds can often help keep the temperature stable during demanding rendering tasks.
Also, take a look at your power supply unit (PSU). An underpowered PSU may drop voltage when under heavy load, leading to unexpected crashes or performance issues with your GPU. Verify that your PSU rails are consistently delivering a +12 V output. Sometimes, simply replacing or swapping cables can fix intermittent power problems that affect render stability.
| Action | Tool/Check | Example |
|---|---|---|
| Temperature Monitoring | Sensor tools | Watch for readings above 85 °C |
| Cooling Maintenance | Fan curve analysis | Clean and check heatsinks |
| PSU Verification | Voltage tester | Confirm stable +12 V output |
Debugging Shader Compilation and Compute Kernel Errors

Shader errors can stop your render process. If you see messages like "undefined identifier" or "illegal memory access," check your compiler logs for clues. These messages usually mean your shader code isn’t following the required language rules.
If you suspect a corrupted shader cache, clear and rebuild it. A "kernel launch failed" error often points to issues with cached GPU code. Try deleting your current shader cache and compile a simple shader to see if the error persists.
Review your log stack traces carefully. Look for recurring patterns that could point to the faulty part of your code. By testing your shader in small steps, you can more easily isolate and fix the problematic segment.
Finally, double-check your shader syntax and confirm that every function is properly defined. Running reduced shader examples can save you time and help keep your render process stable. Follow these steps, and you will be well on your way to troubleshooting shader compilation errors effectively.
Optimizing GPU Render Performance with Benchmarks & Stress Tests
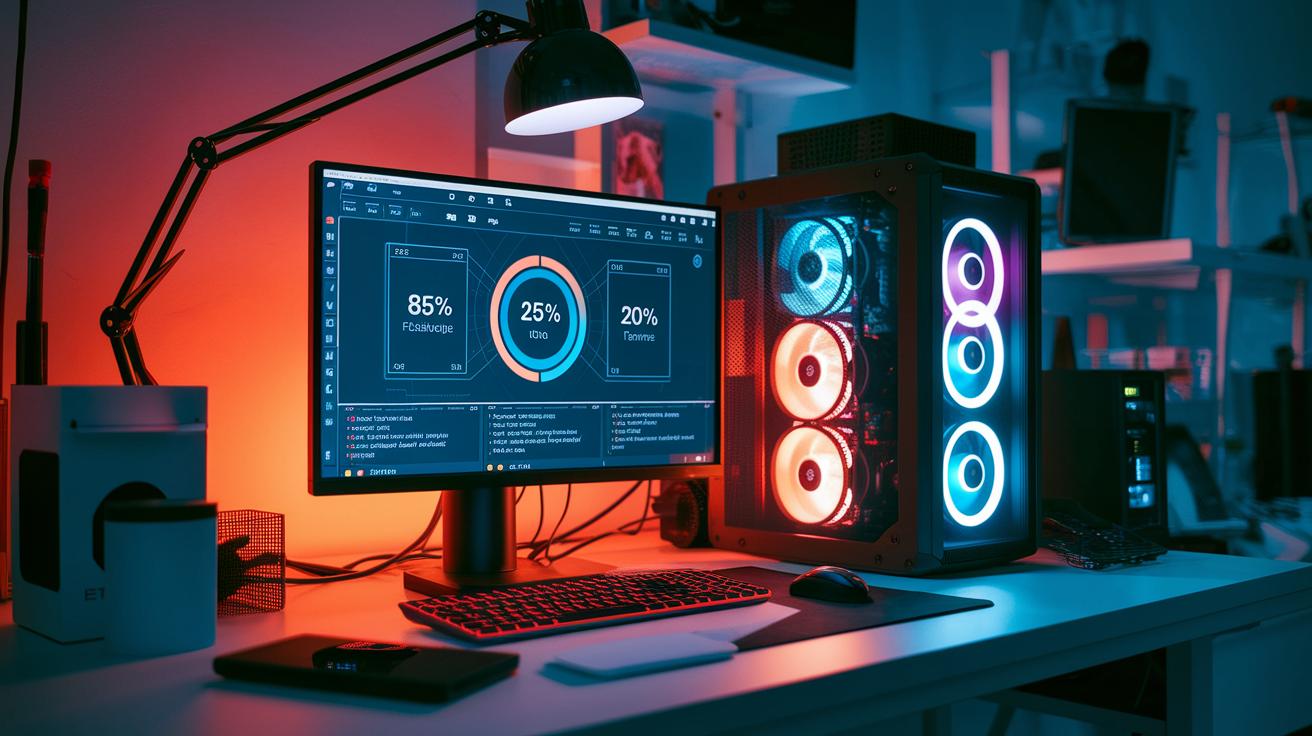
Start with standard benchmark tests. Benchmark software checks how hard your GPU (graphics processing unit) works under different tasks. It measures key numbers like GPU usage, memory use, and frame times (how long it takes to render an image). For example, you might see 85% GPU usage and a steady 20ms frame time, which means your renderer is running close to its limit.
Stress tests help find any bottlenecks by simulating heavy render scenes that push your GPU to its max. If these tests show sudden drops in FPS (frames per second) or odd memory spikes, you can easily spot where problems occur. Compare figures like FPS and render times before and after making changes. For instance, render with default settings, then lower the sample counts and check if FPS rises from 45 to 55. A rise signals that your change is working.
For faster rendering, try these tips:
| Tactic | Benefit |
|---|---|
| Reduce sample counts | Lowers computation work |
| Adjust tile sizes | Balances rendering tasks evenly |
| Enable asynchronous compute | Allows tasks to run at the same time |
Keep track by comparing benchmark results before and after your optimizations. Adjust settings bit by bit to see how much your GPU can handle, so you can balance the load perfectly. In short, using benchmarks and stress tests gives you a clear way to get smoother, faster render performance even with the heaviest workloads.
Leveraging Diagnostic Tools, Logs & Real-Time Monitoring for Troubleshooting

Begin by using tools like NVIDIA Nsight and GPU-Z to pull and review GPU logs. Nsight’s timeline shows frame drop events clearly, and GPU-Z provides real-time updates on load, memory use, and temperature trends. This lets you quickly see signs of TDR resets and other error events that could signal deeper issues.
Next, use command-line utilities to extract specific error codes from your logs. For instance, running a command like:
grep "TDR" gpu.log
will help you pick out key messages that point directly to driver resets. Automated scripts can also filter error codes, which speeds up the response to recurring problems.
Then, rely on real-time dashboards to monitor utilization metrics. These dashboards show critical data such as GPU load and memory consumption. This information helps you figure out if changes in load or temperature align with rendering faults.
- Review logs with diagnostic tools.
- Extract error codes using command-line tools.
- Watch GPU load and memory in real time.
Regularly checking logs and using these monitoring strategies helps you detect and fix issues in GPU rendering tasks promptly.
Advanced API & Pipeline Debugging: DirectX and Vulkan Fault Analysis

When working with DirectX, you might encounter device removal errors (DXGI_ERROR_DEVICE_REMOVED). To fix this, we recommend activating debug layers and studying the error reports closely so you can spot any out-of-order calls. For example, if a log shows "DXGI_ERROR_DEVICE_REMOVED detected," you can adjust the API timeouts accordingly. This step is key to resolving DirectX bugs.
For Vulkan, the process is similar but with its own twist. Start by enabling Vulkan validation layers to catch any invalid commands or synchronization issues. These layers give you detailed feedback when APIs send unexpected signals or when command buffers hang. Running a minimal test can reveal misconfigurations before they impact larger projects.
In troubleshooting pipeline issues, it helps to review pipeline state objects (which control the rendering stages) and synchronization primitives (which ensure processes run in the proper order). Misconfigured settings can trigger errors that ripple through the pipeline. A practical approach is to isolate parts of the rendering process and test them one by one. For instance, you might disable certain sync operations to see if the problem still occurs.
By following a systematic debugging process, you can trace problematic calls back to their source. Keep an eye on error logs and verify each API interaction to maintain a stable rendering environment, ensuring both DirectX and Vulkan run as expected.
Final Words
In the action, we explored rapid steps from checking temperatures and verifying drivers to diagnosing VRAM overload and shader errors. We detailed how to clear caches, adjust settings, and leverage diagnostic tools for solid gpu rendering troubleshooting.
Each segment provided a clear, step-by-step plan to help you pinpoint issues and optimize performance. By applying these proven techniques, you can boost reliability and speed, ensuring smoother workflows and on-time projects. Keep experimenting and refining your process for even better results.
FAQ
What does GPU rendering troubleshooting on Reddit involve?
GPU rendering troubleshooting on Reddit involves checking VRAM usage, verifying driver versions, and examining error logs. Community members often share steps like cache resets and texture optimizations to quickly resolve rendering issues.
How do I fix NVIDIA GPU driver issues, graphics card problems, or driver errors?
Address NVIDIA GPU driver issues by updating or clean-installing drivers from NVIDIA’s site, and ensure compatibility with your CUDA toolkit and rendering engine. This process resolves driver conflicts and related graphics card errors.
How can I troubleshoot general GPU problems, including when a GPU isn’t working properly or shows error symptoms?
Troubleshoot general GPU issues by checking power supply, temperature, and VRAM usage; review log files for errors like TDR or illegal memory access; then update drivers or rebuild kernel caches as needed.
How do I fix GPU artifacting?
GPU artifacting indicates rendering glitches. Resolve it by lowering texture resolutions, verifying that the GPU isn’t overheating, and ensuring drivers are up to date to remove corrupted caches or conflicting settings.
What are the signs of a faulty GPU?
A faulty GPU often shows black frames, unexpected crashes, artifacting, overheating, and error messages related to low VRAM or driver resets. These symptoms help pinpoint hardware or configuration issues.
