

Have you noticed your computer freezing during gaming or while watching videos? A failing GPU scheduler (the part that manages graphics tasks) might cause a VIDEO_SCHEDULER_INTERNAL_ERROR. This error often shows up due to outdated drivers, conflicting software, or even a loose GPU connection.
In this guide, we explain simple, clear steps to help you locate the problem and fix it. By following our practical approach, you can boost your computer's speed and performance, ensuring your system runs smoothly.
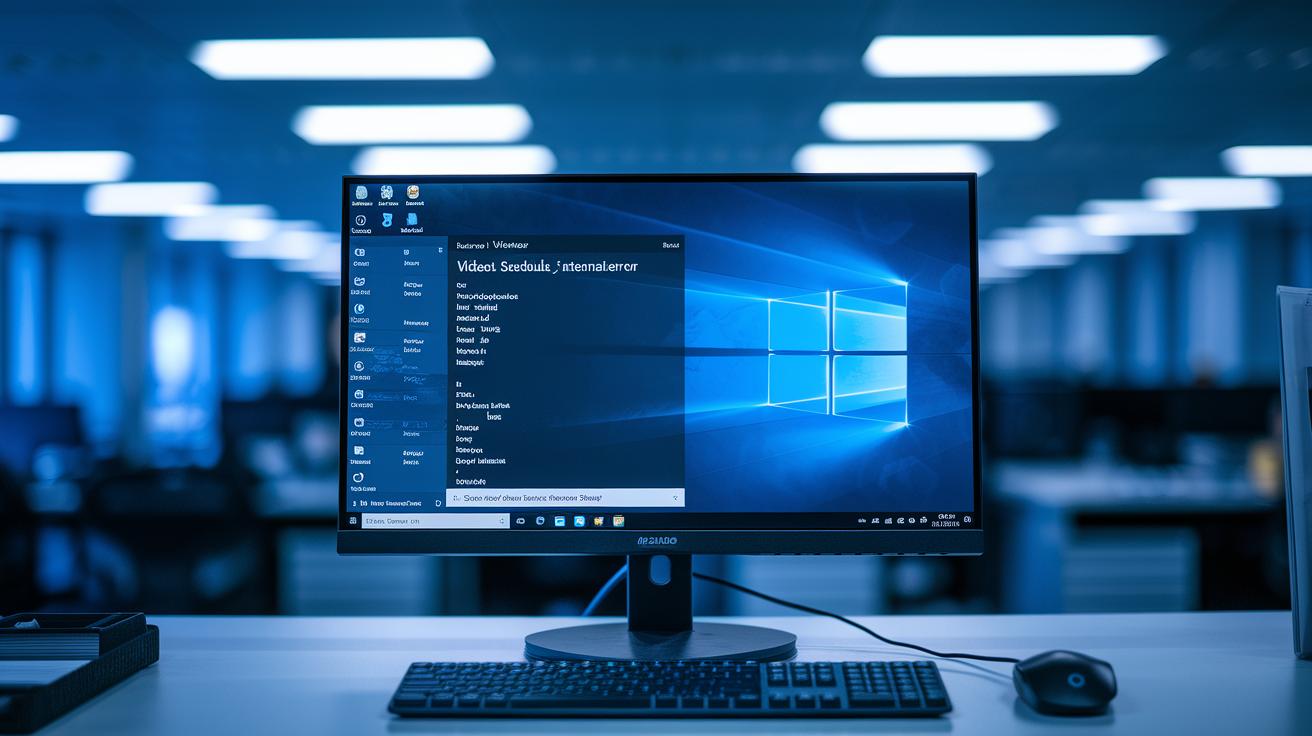
GPU Scheduler Troubleshooting: Step-by-Step Diagnostic Framework
When the internal GPU scheduler fails and throws a VIDEO_SCHEDULER_INTERNAL_ERROR, you might see a Blue Screen of Death while gaming or watching videos. This error often stems from issues like malware, conflicts with antivirus software, outdated drivers, hardware acceleration problems, recent Windows updates, or even a loose GPU connection. Follow these six steps to pinpoint the problem and resolve it.
First, reproduce the error and capture system logs. This helps you identify the conditions under which the fault occurs and locates the exact point of failure. Next, run a virus scan to rule out malware, since unwanted software can unsettle the scheduler. Then, verify that your graphics card driver is up to date and not corrupted; outdated or mismatched drivers are a common culprit.
After checking the driver, review your hardware acceleration settings. Although these settings are designed to boost performance, any misconfiguration can disrupt the scheduler. Following that, inspect recent Windows updates because sometimes a patch might introduce new issues. If the error started after an update, consider rolling back the changes. Finally, ensure that the GPU is firmly seated in its slot, particularly if your system has been moved around recently.
Diagnostic steps include:
- Reproduce the error and capture logs.
- Run a virus scan.
- Verify GPU driver integrity.
- Test hardware acceleration settings.
- Inspect Windows updates or roll back recent patches.
- Check the physical seating of the GPU.
These steps will help you isolate the root cause and guide you to effective solutions for better GPU scheduling performance.
Diagnosing Video Scheduler Internal Error Codes and Logs
Interpreting Event Viewer Entries
Windows Event Viewer records the VIDEO_SCHEDULER_INTERNAL_ERROR with clear details. You may see the Source field show Windows Error Reporting and the Event ID indicating the error code. The faulting process, like nvlddmkm.exe, tells you which GPU (graphics processing unit) driver is involved. To export these logs, simply select the event, right-click, and choose the export option. For example, an entry might read: "Source: Windows Error Reporting, Event ID: 1001, Faulting Process: nvlddmkm.exe." Analyzing these details helps you match the error with parts of the GPU scheduler and spot issues like scheduling loop stalls.
Profiling with NVIDIA Nsight
Nsight Systems is a strong tool for checking GPU thread execution times. Set it up to capture a trace by running a command such as:
nvidia-smi dmon
and use Nsight’s built-in capture tool along with it. This capture reveals timing issues in the command queue. By linking trace events with known scheduler problems, you can see when errors like IRQL changes happen. Reviewing mini-dump files further uncovers any queuing issues. This approach helps you isolate GPU scheduler faults and move to quick fixes.
Resolving Driver Compatibility and Firmware Updates in GPU Scheduling
A missing or corrupt GPU driver can cause your scheduling to stop. Driver issues can slow down the performance of your GPU. Generic Windows builds often miss key improvements that vendor drivers from NVIDIA or AMD provide. We recommend replacing these with manufacturer-approved drivers to cut down on issues. Following the best practices in the driver update guide helps keep your system stable. Running tools like CHKDSK and SFC can fix system file problems. For example, type sfc /scannow in your command prompt to check for and fix corrupted files before updating your driver.
Firmware mismatches can also lead to scheduling glitches. If your firmware does not meet the requirements of your current drivers, scheduling may suffer. Use your manufacturer’s firmware update tool to correct these differences. Sometimes, if a new driver update introduces problems, you might need to roll back to an earlier version. Updating, rolling back, and verifying your GPU drivers and firmware in this way ensures smoother scheduling and improved system performance.
Memory Allocation Inconsistencies and Contention in GPU Scheduling

Memory fragmentation (when free memory is split into small chunks) and memory leaks (when memory is not released after use) can use up all available memory pools. This often causes the GPU scheduler to pause. When memory is not managed properly, commands in a multi-threaded setup may be dropped or delayed. For example, early in my work on pipeline optimization, I noticed that even one memory leak could slow down the entire render process. This experience shows why monitoring memory allocation and resource use is essential.
Another challenge is CPU-GPU resource contention. When multiple tasks compete for shared resources like the bus or processing cores, delays or lost commands can occur. In practice, shifting workloads to balance resource use often helps resolve these conflicts. I once tuned concurrent threads and saw the queued commands improve noticeably within a few cycles. Using diagnostic tools can make it easier to spot and fix these issues.
| Tool | Purpose | Sample Command |
|---|---|---|
| NVIDIA-smi | Check current memory usage and process list | nvidia-smi dmon |
| Nsight Systems | Trace concurrency and API timing | nsys profile –trace=cuda,nvtx |
| Windows Performance Recorder | Analyze bus and CPU-GPU contention | wpr -start GPU |
By reducing memory fragmentation and sharing system resources more evenly, you can boost scheduler reliability and overall GPU performance. Addressing these issues early helps ensure smooth command execution and efficient real-time processing.
Addressing Interrupt Timing Loops and Scheduler Latency Spikes
Sometimes, when interrupt request levels (IRQL) or PCIe interrupts are not set up correctly, command queues get stuck. This can lead to longer render times, dropped frames, or even a complete stall of compute operations. For example, after a chipset update, you might see frames drop during heavy render work. This points to hardware interrupts that do not match the GPU's work pattern.
Using kernel-level diagnostics with WinDbg, we can pinpoint these scheduling problems. Simple commands like "!irp" and "!thread" help uncover sudden jumps in IRQL, which signal the exact process or driver causing the issue. Often, these interrupt hiccups come from outdated motherboard chipset drivers or misconfigurations in Device Manager.
To fix these issues, try adjusting the interrupt affinity. This means directing certain PCIe interrupts away from CPU cores that are already busy. Alternatively, updating the motherboard chipset drivers using the manufacturer's update tool can also help. In one case, an engineer updated the drivers and modified the affinity settings, which eventually stabilized the scheduler. This clearly shows that proper interrupt configuration is key to smooth GPU operations.
Mitigating Power Management and Thermal Throttling in GPU Scheduling

Power-saving profiles can pause GPU clocks and create idle times in the scheduler, which interrupts continuous task processing. For instance, if your system stops power to non-essential functions, the GPU clock may drop unexpectedly. Switching to a Windows High Performance plan stops these unnecessary drops, ensuring your GPU runs steadily during rendering or compute tasks. Turning off optional GPU Boost features also prevents sudden frequency changes that could stall scheduling and disrupt dispatch intervals.
High temperatures can also lower scheduler performance. When a GPU reaches over 85 °C, thermal throttling cuts the core frequency and slows the command queue. Keeping an eye on temperatures and adjusting fan curves with vendor tools can help avoid these issues. By fine-tuning power and cooling settings, you ensure the GPU clock remains stable and latency stays low. This approach keeps your scheduler running smoothly, even during extended heavy use.
Validating Scheduler Stability with Performance Monitoring and Stress Testing
After you apply fixes, it is important to check that your GPU scheduler (the system that manages graphics tasks) works correctly. Begin by watching key numbers like the queued kernels per second (commands waiting to run) and MMU page faults (memory errors) using tools such as nvidia-smi dmon or NVML (NVIDIA Management Library). Running nvidia-smi dmon provides real-time data that shows if GPU commands are queuing as expected.
Next, run long stress tests that push both compute and graphics workloads. These tests mimic heavy system use to see if errors like Blue Screen of Death (BSOD) or delays reappear. If you notice a spike in kernel counts or page faults during these tests, it means some issues may still be present.
Then, compare logs collected before and after you made the fixes. This step should confirm that any VIDEO_SCHEDULER_INTERNAL_ERROR messages have been cleared. If your logs before the fix showed frequent errors and now they are clean, you can be confident that the changes worked.
To keep things simple, you can:
Using these techniques ensures that your GPU scheduler is stable and that common issues causing interruptions have been resolved.
Final Words
In the action, we laid out a clear six-step diagnostic framework, from capturing errors and reviewing logs to updating drivers, checking hardware seating, and tuning power settings.
We also explained how tools like Event Viewer and NVIDIA Nsight help you decode problematic exit codes and monitor fixes. Monitoring performance and stress testing further confirms that the changes work.
Remember, troubleshooting common gpu scheduler issues ultimately leads to more predictable performance and faster outputs. Embrace these steps, and watch your production workflows achieve a smoother, more reliable operation.
FAQ
Q: How do troubleshooting posts on Reddit address common GPU scheduler issues?
A: Troubleshooting posts on Reddit address common GPU scheduler issues by detailing driver conflicts, hardware acceleration problems, outdated firmware, and loose connections. They recommend checking logs and updating drivers for a reliable fix.
Q: How does troubleshooting GPU scheduler issues on Windows 10 work?
A: Troubleshooting GPU scheduler issues on Windows 10 involves verifying driver integrity, adjusting hardware acceleration settings, checking for conflicts from recent Windows updates, and ensuring the physical seating of the GPU is secure.
Q: How does the Video Scheduler Internal Error affect Windows 11 systems?
A: The Video Scheduler Internal Error affects Windows 11 when the GPU’s internal task controller fails, disrupting media playback or gaming. This often necessitates driver updates, thorough log reviews, and hardware inspections.
Q: How can hardware accelerated GPU scheduling cause issues?
A: Hardware accelerated GPU scheduling can cause issues when drivers, system updates, or incompatible settings lead to conflicts. These problems can result in scheduling errors or system crashes and are often resolved through driver updates or toggling the feature.
Q: How do you turn off Hardware Accelerated GPU Scheduling in Windows 10 and 11?
A: Turning off Hardware Accelerated GPU Scheduling in Windows involves accessing the display settings in Windows 10 or 11, disabling the feature, and testing performance afterward to see if related scheduling errors are resolved.
Q: What are some common problems encountered with GPUs?
A: Common GPU problems include driver conflicts, overheating, hardware acceleration malfunctions, and resource contention. These issues are typically diagnosed through log analysis, hardware tests, and physical inspection of the GPU.
Q: How do you diagnose GPU hardware issues effectively?
A: Diagnosing GPU hardware issues effectively involves checking driver versions, running security scans, reviewing system logs for error codes, and physically inspecting the GPU connection alongside using diagnostic commands.
Q: How can you fix issues when GPU hardware accelerated scheduling is not showing?
A: Fixing missing GPU hardware accelerated scheduling usually involves updating or reinstalling GPU drivers, ensuring system settings match feature requirements, and checking for conflicts with recent Windows updates or other third-party tools.
