

Ever wonder if you’re overspending on graphics cards (GPUs) that sit idle most of the time when training your deep learning models? If your top-tier GPUs run less than 30% of the time, you might be burning cash and slowing down your results. In this guide, we share clear, practical steps to boost efficiency, reduce costs, and maximize every dollar you invest in hardware. We explain how to balance model complexity, choose the right batch sizes (the number of training examples processed at once), and match your setup to your hardware capabilities for a smoother deep learning workflow.
Mastering GPU Training Fundamentals for Deep Learning
GPUs (graphics processing units) are essential for deep learning because they can quickly process large amounts of data with parallel operations. When a GPU works less than 30% of the time, you risk wasting valuable compute resources. For example, a high-end GPU may cost around $30,000, and underused cloud setups might cost hundreds of dollars per hour.
Optimizing GPU training is about more than raw speed, it also helps you manage costs better. We recommend continuously monitoring your system. You can find more detailed tips on optimizing GPU performance for production workloads at https://studiogpu.com?p=.
Key factors to track include:
- GPU utilization percentage – the ratio of active processing time to idle time.
- Memory usage and bandwidth – how efficiently data moves and is processed inside the GPU memory.
- Power consumption – the energy the GPU uses under different loads.
- Thermal limits – the highest safe temperatures before the GPU slows down to protect itself.
Balancing the model size with the batch size and available GPU memory is crucial. A deep neural network with too many parameters can exceed the GPU’s memory, leading to errors. Adjusting the batch size is a straightforward way to keep the processing pipeline filled while avoiding stalls. By fine-tuning batch sizes, you can boost parallel processing efficiency, ensuring each GPU works close to its peak capacity. This balance between model complexity and GPU capability is key to speeding up deep learning training and cutting down on operational costs.
Hardware Acceleration Techniques in GPU Deep Learning Training
Efficient deep learning training starts with matching your hardware to the needs of your models. Keeping compute and storage close together cuts down on data wait times. Using NVMe SSDs (fast storage devices) or local scratch drives helps your data load quicker so your GPUs don't sit idle. We also recommend scheduling jobs based on load patterns to ensure every GPU stays busy.
Selecting the Right GPU Architecture
Picking the best GPU depends on what your model requires. Look at factors like streaming multiprocessor (SM) count, tensor-core speed, and memory bandwidth. NVIDIA’s Ampere architecture works well for many models by offering a strong mix of compute power and smooth memory handling. For bigger, more complex models that need extra muscle, the Hopper architecture steps in with higher SM counts and improved connections. In short, Ampere is a great choice for smaller models with frequent training sessions, while Hopper fits larger, compute-heavy projects.
Leveraging High-Speed Interconnects
When working with multiple GPUs, fast communication between them is vital. NVLink (a connection that offers high data speeds) reduces delays compared to standard options like PCIe 4.0/5.0. This extra speed matters when your tasks require constant data exchange across GPUs. We suggest storing data on local NVMe SSDs to sidestep network slowdowns and scheduling heavy data transfers during less busy times. This approach keeps GPUs active and maintains a smooth training pipeline.
Software-Level Optimization and Mixed-Precision Strategies

Mixed-precision training uses FP16 (16-bit floating point) computations alongside FP32 (32-bit floating point) master weights. This method can boost throughput by 20-30% while preserving model accuracy. Frameworks like PyTorch AMP or TensorFlow mixed_float16 provide simple API calls to help you start quickly. For instance, wrapping your forward pass in a block such as "with torch.cuda.amp.autocast():" lets you perform lower-precision math on tensors. Dynamic loss scaling automatically adjusts the scale factors during training to maintain numerical stability. You might use a snippet like "scaler = torch.cuda.amp.GradScaler()" followed by "scaler.scale(loss).backward()". Testing on a smaller dataset helps confirm that this technique speeds up computation without sacrificing accuracy.
Implementing Mixed-Precision Training
To implement mixed-precision training, you call framework-specific methods that manage precision conversion and loss scaling. Begin by enabling mixed_float16, then adjust your optimizer so it handles FP32 weights correctly. In frameworks such as PyTorch, these changes are minimal. We recommend running initial experiments to make sure that performance improvements are realized and that dynamic loss scaling effectively handles any numerical issues.
Activating CUDA Toolkit and Library Optimizations
Compiler and library tweaks can further improve kernel performance. Compile your code with flags like -O3 and –use_fast_math to generate optimized binaries. Setting the environment variable CUDNN_AUTOTUNE=1 allows the system to pick the fastest kernels available in libraries such as cuBLAS and cuDNN. For example, include a command like "export CUDNN_AUTOTUNE=1" in your setup script. Moreover, using CPU-pinned memory by setting DataLoader(pin_memory=True) helps overlap data transfers with GPU computations. These software adjustments and library configurations work together to reduce iteration times and boost deep learning efficiency.
Combining mixed-precision training with CUDA toolkit enhancements can unlock significant performance gains in your deep learning workflow. Test these methods on a range of model architectures, and make regular adjustments to fine-tune speed and efficiency in production environments.
Efficient Data Pipeline and Batch Processing for GPU Training
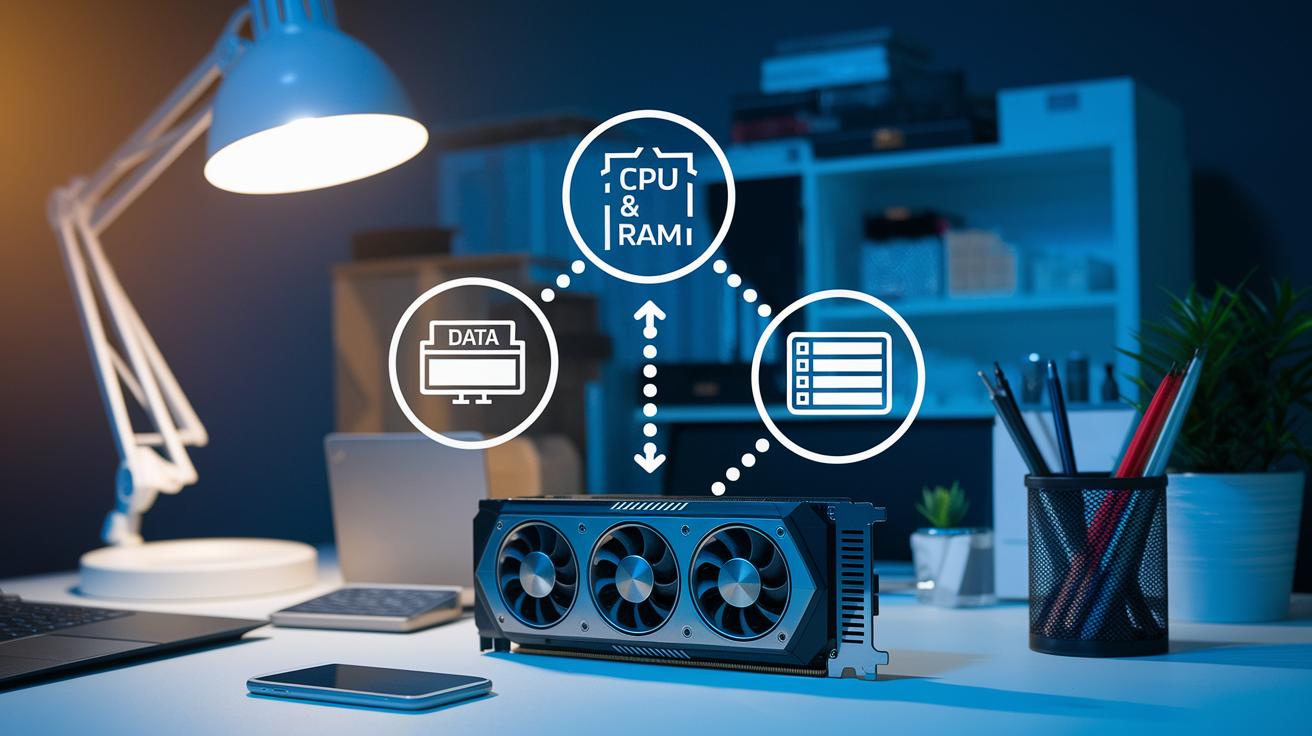
A smooth data pipeline makes sure your GPU always has work to do. When the CPU takes too long to prepare data or the I/O system works slowly, the GPU can sit idle and waste its power. We prevent this by using several DataLoader workers along with prefetch buffers. For example, in PyTorch you can set up a DataLoader like so: "DataLoader(dataset, batch_size=32, pin_memory=True, num_workers=4)". Here, pinned memory (a fixed block of RAM for quicker transfers) lets data load in the background while the GPU works on the current batch. Prefetching means the next batch is loaded while the current one is still processing, keeping everything moving smoothly.
We also adjust the batch size dynamically based on the GPU's available memory. This approach helps balance the workload and reduces the risk of out-of-memory (OOM) errors when training changes. Placing your datasets on fast NVMe or SSD drives further cuts down the time needed to load files. By combining multiple DataLoader workers, prefetching, asynchronous streaming, and smart batch tuning, we create a system that keeps the GPU busy and running near peak capacity. This efficient setup speeds up deep learning training and avoids costly delays.
Scaling Deep Learning Workloads with Multi-GPU and Distributed Training
Synchronous training brings all nodes together in a unified workflow. Tools like Horovod and PyTorch Distributed Data Parallel (DDP) let you update gradients at the same time across GPUs and nodes. In this setup, each GPU sends its gradient updates using methods like ring or tree reduction. For NVIDIA platforms, NCCL (NVIDIA Collective Communication Library) is a common choice because it offers low latency and high throughput. For example, eight GPUs can compute and share gradients simultaneously so that every GPU is in sync before the next step starts.
Gradient accumulation helps you work around memory limits while still mimicking large-batch training. You do this by summing the gradients from several small batches, effectively simulating a larger batch without overloading your GPU memory. This is particularly useful when your GPU can only handle a certain batch size. Elastic Horovod even adds fault tolerance for cloud clusters, so if one node slows down, the whole training process keeps moving. You might try adjusting your training loop to accumulate several mini-batches before performing one backward pass.
Efficient multi-node GPU training calls for careful planning. Choosing the right communication backend, whether NCCL or Gloo, depends on your hardware and reduction method preferences. Best practices include balancing workloads, overlapping computations, and scheduling jobs according to load patterns to prevent GPUs from sitting idle. For instance, using ring reduction can speed up communication, and adding asynchronous steps keeps your GPUs busy. These strategies help you scale reliably and boost throughput for deep learning workloads.
Advanced Memory Management and Kernel Fusion for Improved Throughput

To prevent memory fragmentation, we recommend preallocating one large, contiguous buffer and carefully arranging your tensor layouts. When tensors are scattered throughout memory, the GPU (graphics processing unit) must work harder to fetch data, which can lead to delays and wasted resources. Instead of relying on dynamic allocation that scatters your data, preallocate a buffer so that all tensors sit sequentially. This strategy reduces fragmentation and provides more consistent use of memory bandwidth, making it easier to spot and fix bottlenecks. Monitoring memory bandwidth is vital because it shows how quickly data moves from system memory into the GPU, ensuring that you spend your compute cycles processing data rather than waiting for it.
Kernel fusion further increases efficiency by cutting down the overhead of launching many small operations. Tools like TensorRT (an NVIDIA inference optimizer) and XLA (Accelerated Linear Algebra) can automatically combine multiple operations into a single fused kernel. This fusion reduces startup delays and keeps data closer to the computation, which, for example, means you can merge convolutions with activation functions into one pass. By doing so, you minimize repeated reads and writes, streamline the process, and make better use of your GPU resources during deep learning training.
Another practical method is using cudaMemcpyAsync with CUDA streams to accelerate data transfers. Unlike Unified Memory, overlapping transfers from the host (system memory) to the device (GPU) with the execution of kernels can offer better performance on steady workloads. A typical command is:
cudaMemcpyAsync(dest, src, size, cudaMemcpyHostToDevice, stream)
This approach allows you to preload the next batch of data into GPU memory while the current one is still processing, which cuts down idle time and improves overall training efficiency.
Profiling, Benchmarking, and Troubleshooting GPU Training Workflows
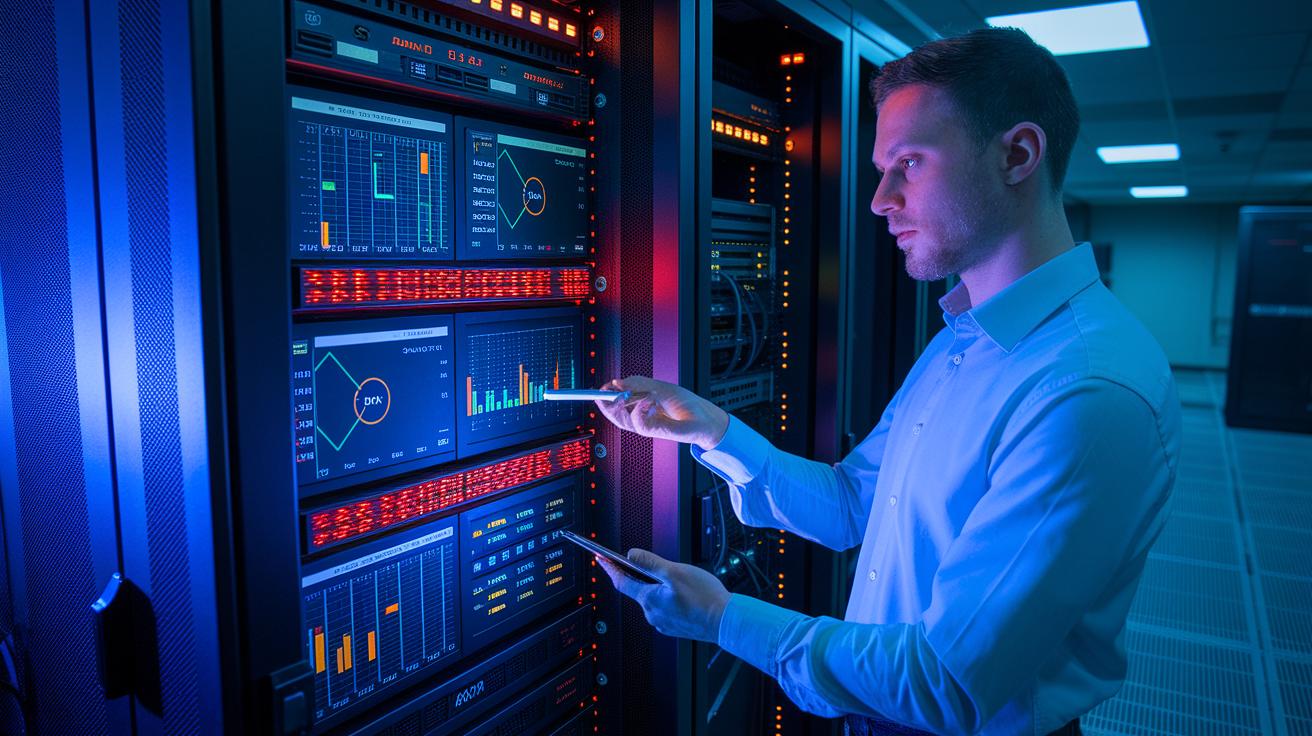
Real-time profiling helps you spot issues in GPU training and boost performance. Tools like Nsight Systems, nvprof, and PyTorch Profiler give you clear data on GPU usage, memory behavior, power, and temperature during training. With these measurements, you can quickly find underused GPUs or identify slow spots. This live data lets you adjust your training process immediately, ensuring every GPU runs at its best. After a training run, tools like TensorBoard or MLflow let you review trends and catch any slowdowns over time. Combining real-time feedback with historical data creates a solid plan to optimize your workflows.
Troubleshooting is just as important as profiling. GPU training can run into common issues like out-of-memory errors, kernel launch delays, and slow data pipelines. If you run into out-of-memory errors, try reducing the batch size or fine-tuning memory allocation. For kernel launch delays, changing the order of tasks or adjusting CUDA streams can help. And if the data pipeline slows things down, refining prefetch settings and increasing the number of data workers may keep the GPU fed consistently. A systematic troubleshooting process and a clear list of profiling metrics help you isolate problems, apply fixes, and keep your training process efficient and scalable.
| Tool | Metric | Command |
|---|---|---|
| Nsight Systems | Utilization/TSC | nsys profile … |
| nvprof | Kernel execution time | nvprof –print-gpu-trace … |
| PyTorch Profiler | CPU/GPU timeline | torch.profiler.profile(…) |
Final Words
In the action, we explored how GPU training fundamentals connect with hardware acceleration, mixed-precision strategies, and efficient data pipelines. We broke down complex topics into practical steps that address everything from memory management to robust profiling. These insights help answer how to optimize gpu training for deep learning while balancing cost and reliability.
We shared techniques to speed up render and training times, ensuring production remains stable during crunch periods. Embrace these strategies to drive faster iteration and smoother workflows.
FAQ
How to optimize GPU training for deep learning in Python and maximize NVIDIA GPU usage?
The inquiry about optimizing GPU training in Python highlights the need for efficient data pipelines, mixed-precision training, and using NVIDIA CUDA tools. These techniques improve GPU utilization and reduce performance bottlenecks.
How does multi GPU training enhance deep learning workflows?
The question about multi GPU training indicates that spreading workloads across several GPUs, using frameworks like PyTorch Distributed Data Parallel, accelerates training and scales model performance while ensuring synchronized updates.
How does LLM training affect GPU utilization?
The inquiry on LLM training GPU utilization shows that training large language models demands higher GPU memory and compute capacity. Balancing workload and batch sizes ensures GPUs run optimally without hitting memory limits.
How do 100% and 0% GPU utilization levels impact deep learning performance?
The question regarding 100% versus 0% GPU utilization suggests that 100% usage may point to fully leveraged resources, while 0% indicates idle hardware, often because of data bottlenecks or misconfiguration. Finding balance is key.
What role does MSI Afterburner play in GPU management?
The inquiry about MSI Afterburner signifies that this tool monitors and adjusts GPU parameters like clock speeds and temperatures, helping fine-tune performance and stability during demanding deep learning tasks.