

Ever wonder why your GPU (graphics processing unit) workflow might slow down even when everything seems set up correctly? Sometimes a loose cable, an incorrect BIOS setting (the basic system that starts your computer), or even bad drivers can cause unexpected delays. In this guide, we'll walk you through simple, step-by-step checks, from ensuring hardware is connected correctly to fine-tuning memory management. You'll learn practical tips to keep your GPU running smoothly so that you spend more time creating and less time troubleshooting.
Step-by-Step Troubleshooting of Common GPU Workflow Issues
-
Check Hardware Connectivity
Turn off your computer completely and unplug it from the power outlet. Remove and then reconnect the GPU power and data cables. A loose cable connection can cause the GPU to go unnoticed. -
Verify BIOS/UEFI Settings
Restart your computer and press keys like Delete, F2, or F10 to enter the firmware settings. Ensure the motherboard detects your GPU and that hardware acceleration (for example, PCIe settings) is turned on. Often a BIOS misconfiguration leads to wasted compute time. -
Validate Driver and Software Integrity
Confirm that your GPU drivers meet the needs of your rendering or compute engine. Outdated or mismatched drivers may cause crashes and trigger Windows Timeout Detection and Recovery (TDR) resets when the GPU doesn't respond for more than two seconds. Update or roll back your drivers as needed, and check that CUDA (NVIDIA compute toolkit) and OptiX libraries are consistent with your workload. -
Clear and Rebuild Kernel Caches
Corrupt kernel caches can result in illegal memory access errors. Delete the old cache files and allow the system to rebuild them to clear any conflicts. -
Optimize Memory Management
Using high-resolution assets like 8K textures or dense meshes may exhaust your VRAM, leading to crashes or blank frames. Adjust the texture resolution or reduce the number of polygons to free up VRAM for essential tasks. -
Consider Pre-configured Stacks
Using a pre-configured and validated stack can help avoid recurring issues. It ensures that your GPU functions right away and improves your overall workflow efficiency.
Diagnosing Graphics Card Malfunctions in GPU Workflows
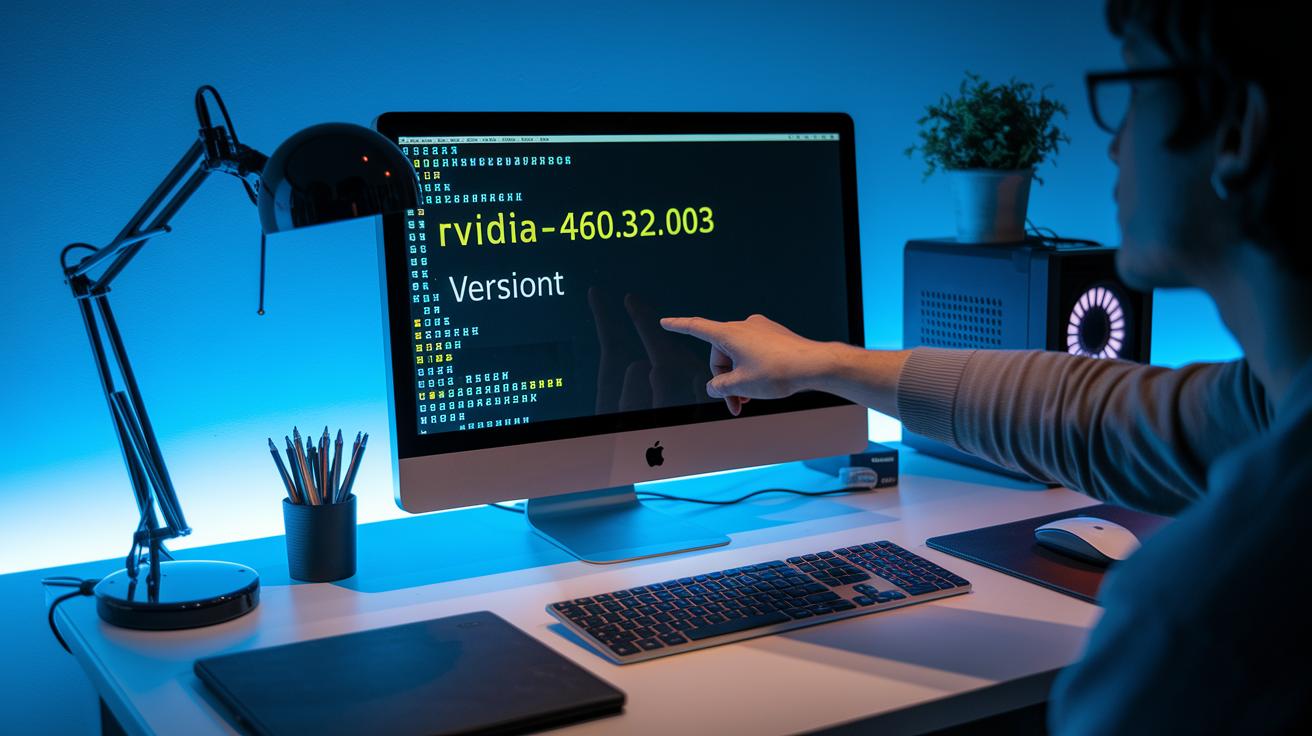
Start by checking if your GPU driver is installed correctly. Run a command like nvidia-smi (a tool that shows your GPU status) to confirm the driver version. For instance, you might see "version 460.32.03."
Next, compare your driver version with what your render or compute engine recommends. If the driver and libraries like CUDA (NVIDIA compute toolkit) or OptiX do not match, your system may crash.
If you notice the driver is outdated or not right for your tasks, update it or roll it back. For a deeper look, review detailed outputs from nvidia-smi. For example, if a log displays "Driver 460.32.03" but your system expects "465.xx," consider rolling back.
Also, check Windows Timeout Detection and Recovery (TDR) logs. These logs can show error messages, such as "Display driver stopped responding." They occur when the GPU takes too long to respond.
Next, remove any corrupt kernel caches that might be causing conflicts. Clear old cache files and rebuild the cache so the GPU can initialize without issues. After cleaning up, run another test to ensure the logs no longer show cache errors.
Finally, reboot your system and run a short test to confirm that your driver is working properly and your system is stable.
| Diagnostic Command | Expected Output |
|---|---|
| nvidia-smi | Driver version, GPU status, and running processes |
| Event Viewer Logs | Error messages about TDR resets or no errors |
Debugging Rendering Delays and VRAM Memory Exhaustion in GPU Workflows

When you work with high-detail assets like 8K textures, dense meshes, or complex volumetric elements, VRAM (video memory) can get overloaded. This overload may lead to crashes or black frames during your render. We recommend starting with performance tests to check how VRAM is used. One simple strategy is to lower texture resolutions gradually. For instance, switch from 8K textures to 4K and observe how performance improves.
Next, consider reducing the number of polygons in your models. Fewer polygons usually result in smoother, more stable rendering. It is also important to ensure that all render nodes in your distributed system run the same certified driver version. Inconsistent versions can cause artifacts and delay frame processing. Automated checks can help verify that each node is set up correctly.
Here is a quick checklist to diagnose and fix the issues:
- Run a performance benchmark to measure VRAM allocation and compute throughput.
- Lower asset complexity by reducing both texture resolutions and polygon counts.
- Verify that every render node uses the same, certified driver version.
- Run the benchmarks again to confirm improved render speed and stability.
- Watch for any artifacts, like black frames or delay spikes, and adjust as needed.
- Use rendered output logs to check for any further mismanagement of memory allocation.
| Action | Outcome |
|---|---|
| Reduce texture resolution | Lower VRAM usage and faster render times |
| Lower polygon count | Smoother rendering with fewer crashes |
Hardware Acceleration and Thermal Limit Assessment in GPU Workflows

When your GPU runs hot, it may struggle with performance if BIOS/UEFI settings prevent acceleration or if the cooling system cannot keep temperatures in check. Let’s walk through simple steps to verify and adjust these settings.
Verifying Hardware Acceleration in BIOS/UEFI
- Power off your system completely and unplug the power cable.
- Turn the computer back on and press keys like Delete, F2, or F10 to enter the firmware setup.
- Find the GPU acceleration settings (for example, PCIe lanes and GPU passthrough options).
- Make sure hardware acceleration is enabled. If you see a legacy PCIe configuration, update it to a full GPU passthrough mode and save your changes.
This quick check helps ensure your GPU works efficiently, boosting overall performance and responsiveness.
Diagnosing Cooling System Efficiency
- Confirm all fans are running and the heatsink is securely in place.
- Check the sensor readings to see if temperatures remain high even during light use.
- Adjust cooling profiles or firmware fan curves if that option is available.
- Improve airflow inside the chassis by removing any cables or debris that block vents.
By keeping hardware acceleration on and the cooling system effective, you lower the risk of throttling and sudden resets during demanding GPU tasks.
Optimizing Shader Compilation and Compute Precision in GPU Workflows

Shader compilation errors can be a hassle, usually popping up when your CUDA (NVIDIA compute toolkit) or OptiX library versions don’t match what your render engine needs, or when the libraries are outdated. If you see a log message like "shader compile error: version mismatch", it’s a sign that an update is required.
To fix these issues, try this simple checklist:
- Look at your shader logs for any error messages about version mismatches.
- Confirm that your CUDA and OptiX libraries are updated and the same on every part of your system.
- Clear out old kernel caches and rebuild them to fix any "illegal memory access" errors caused by corrupt data.
- Automate version checks in your pipeline with basic scripts. This ensures all nodes run the same certified driver version and library set.
- Run lightweight pipeline tests to pinpoint compute core usage issues and compute precision problems.
Keeping your library versions aligned and cleaning out old caches regularly will help optimize shader compilation, prevent bottlenecks, and keep your GPU workflows running smoothly.
Stability Optimization Techniques for End-to-End GPU Workflows

Automated health alerts and system reports help you catch issues before they impact your GPU (graphics processing unit) workflows. We suggest running automated testing scripts and health-check procedures in the background. These tools continuously check driver and hardware statuses and warn you of any changes that might lead to system instability. For example, set up a daily script to verify that driver versions match your pre-approved stacks. I once saw a small version drift crash an entire workflow cycle, so automated alerts saved us days of troubleshooting.
Next, add system stability tests that include regular benchmarks. These tests track compute throughput, memory use, and response times after configuration changes. Running benchmarks after each update can show you tuning strategies that may have been missed otherwise. A practical tip is to compare test results from every update to track improvements.
Here is a simple checklist to follow:
- Run automated health-check scripts.
- Validate GPU driver and software versions against your certified baselines.
- Run stability benchmarks to check throughput and response times.
- Review test logs to spot workflow automation issues.
- Adjust configurations using your pre-approved stacks.
| Action | Outcome |
|---|---|
| Automated health alerts | Quick detection of version mismatches or failures |
| Pre-approved stacks | Fewer repeat configuration errors |
Try these stability optimization techniques as part of your GPU workflow best practices. They let you focus on application performance instead of rushing into last-minute debugging. For more details, visit https://studiogpu.com?p=106.
Benchmarking GPU Performance and Real-Time Monitoring in GPU Workflows

Begin by selecting a benchmark suite that captures essential metrics like VRAM usage, compute throughput, and frame rates. These tools record performance details and help you detect trends quickly. For example, you might use a tool that logs VRAM usage every minute and notes, "VRAM at 85% at frame 150."
Next, set up a real-time dashboard to track these metrics and alert you about TDR events (timeout detection and recovery events) or memory leaks as soon as they occur. A live dashboard displays a timeline of performance, making it easier to spot sudden drops in compute throughput or frame rates. Profiling tools can also help you locate bottlenecks that slow down your workflow. You may want to try GPU benchmark software for rendering and AI tasks to handle these needs.
Follow these steps:
- Choose and configure your benchmark suite.
- Set up automated dashboards to monitor performance in real time.
- Create alert rules for TDR events and memory leaks.
- Regularly compare performance metrics to track improvements.
| Metric | Expected Condition |
|---|---|
| VRAM Usage | Under 80% for stable workflows |
| Compute Throughput | Consistent with baseline tests |
Use these methods to measure the impact of fixes and keep your GPU workflows running smoothly.
Final Words
In the action, we walked through a detailed diagnostic flow, from hardware checks and driver validations to managing VRAM usage and ensuring proper cooling configurations. We tackled issues from GPU detection errors to shader compilation mismatches. We also shared strategies for proactive monitoring, benchmark testing, and streamlined troubleshooting common GPU workflow issues. Watching the steps come together can help you boost render and training speeds while keeping processes reliable. Keep iterating, stay curious, and celebrate every improvement along the way.
FAQ
What are the common issues with GPU?
The common issues include driver mismatches, VRAM overload from high-resolution textures, overheating, and corrupt kernel caches. Diagnostic tools like GPU-Z and 3DMark help you identify these problems quickly.
How do I troubleshoot GPU hardware issues?
Troubleshooting GPU hardware issues starts with checking BIOS/UEFI settings, verifying power connections, and making sure drivers are current. Stress tests using tools like FurMark can reveal performance problems and hardware malfunctions.
How can I tell if my GPU is malfunctioning?
A malfunctioning GPU typically shows rendering errors, black frames, or messages such as “Your system does not have a valid NVIDIA virtual PC license.” Monitoring utilities like GPU-Z or Heaven Benchmark help confirm these issues.
What causes GPU failure?
GPU failure can be caused by overheating, inconsistent or outdated drivers, power supply issues, or VRAM exhaustion from heavy workloads. Regular system maintenance and monitoring can minimize these risks effectively.
How do benchmarking tools like FurMark, Heaven Benchmark, and 3DMark help diagnose GPU issues?
Benchmarking tools stress the GPU to reveal stability or thermal issues, measure performance metrics like frame rates and VRAM usage, and guide you in tuning settings for optimal performance.
How do utilities like GPU-Z, AIDA64, and CPU-Z assist in GPU system diagnostics?
These utilities provide detailed insights on system specifications, clock speeds, temperatures, and memory usage, helping you identify performance bottlenecks and troubleshoot GPU workflow issues efficiently.
